Economic Performance of Different Lime Production Routes
Scenario-specific analysis:
Scenario-specific analysis:
The interactive graph below illustrates total CO₂ emissions (kg CO₂/t lime) and specific total cost (€/t lime) across different decarbonization pathways for the lime sector. Click below to get details about the different decarbonization pathways.
The environmental and economic performance of each pathway can be personalized to user-defined scenarios, allowing to explore how changes in commodity prices and emission intensities affect the results.
How to interpret the graph
The alternative configurations are differentiated by:
Customize the scenarios
You can adjust the assumptions used to evaluate the different decarbonization pathways:
Click Update to refresh the graph based on your inputs. To return to default values, use the Reset button.
The following abbreviations are used: NG = natural gas, H2 = hydrogen, EL = electricity, BC = biomethane, BM = biomass, ls = limestone, ETS = CO₂ EU ETS, TS = CO₂ transport and storage.
| Configuration | Heat supply | CO₂ capture | Symbol | Cost | CO₂ emissions |
|---|
Technology mapping:
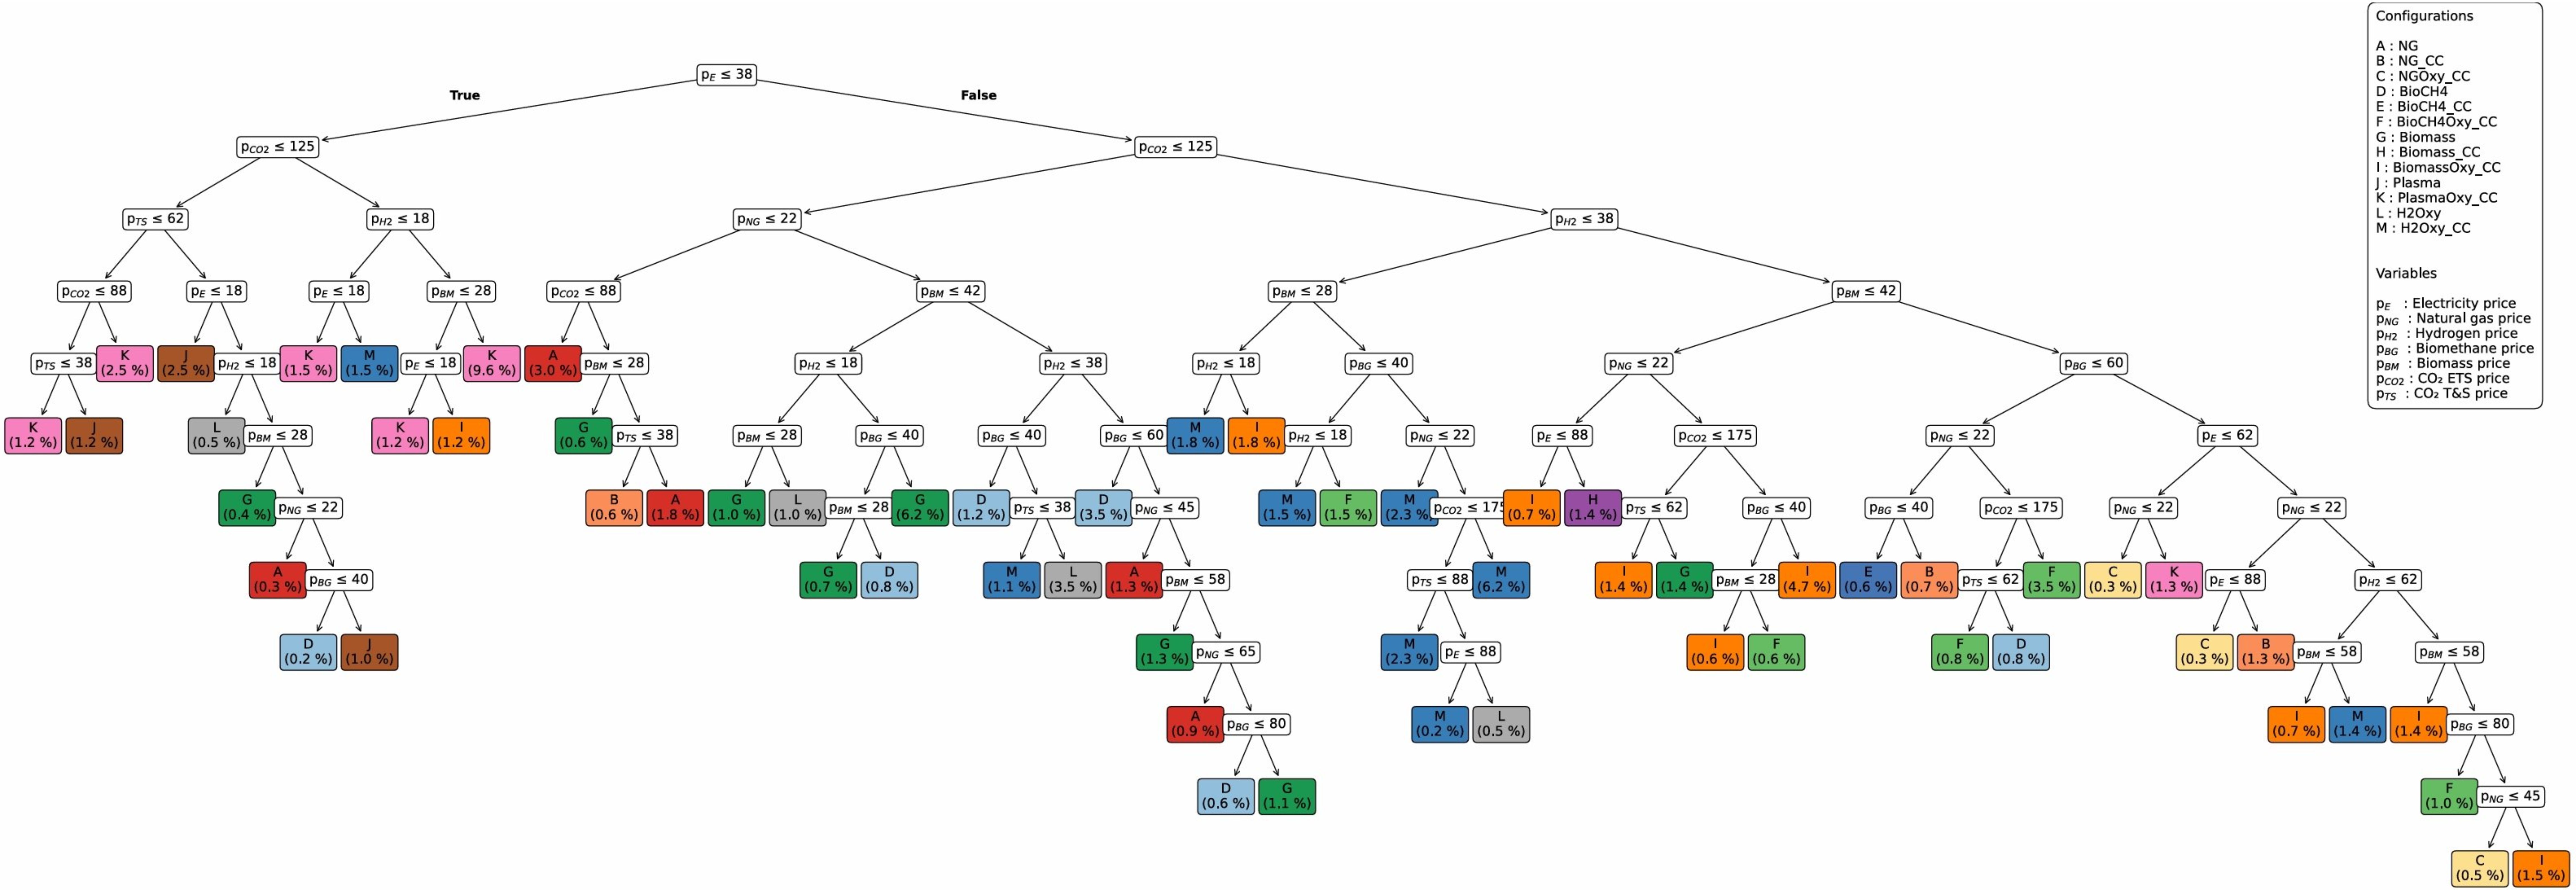
Optimal decarbonization pathways—those that achieve the lowest specific total cost—have been identified for the lime sector across a wide range of pricing scenarios, reflecting market volatility. The market conditions under which each decarbonization pathway is economically optimal are visualized in the decision tree below.