Economic Performance of Different Sugar Production Routes
Scenario-specific analysis:
Scenario-specific analysis:
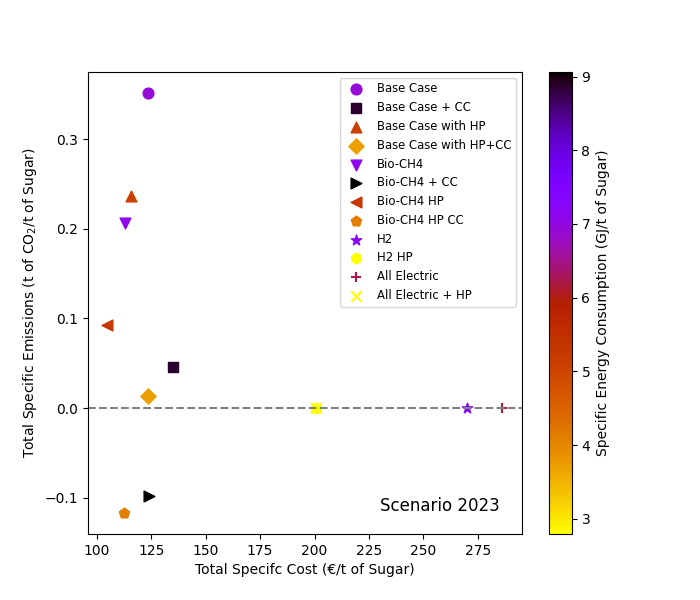
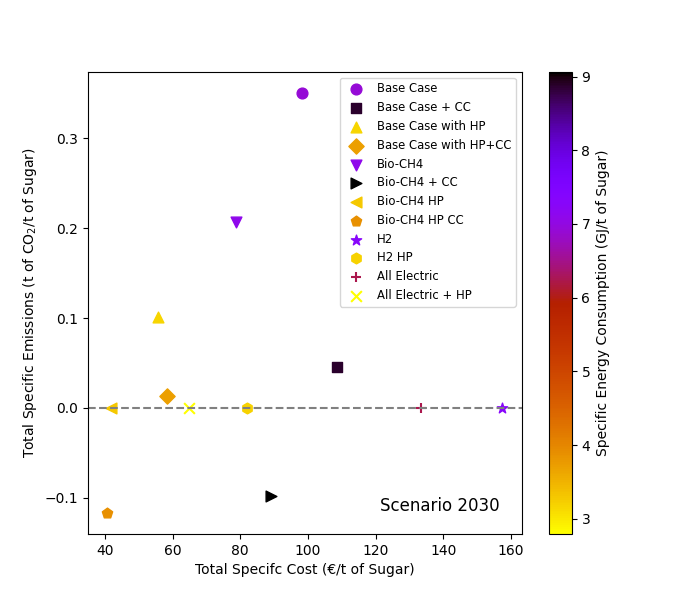
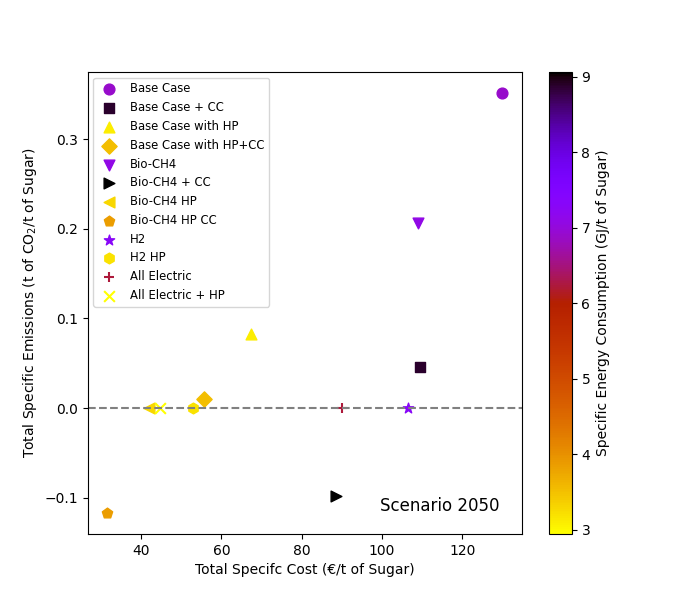
The graphs below illustrate total CO₂ emissions and specific total cost across different decarbonization pathways for the sugar sector. The configuration details are summarized in the Table below.
Configuration |
Boiler - energy vector |
CO₂ capture implementation |
Heat pump integration |
|---|---|---|---|
Base Case | Natural gas |
No |
No |
Base Case + CC | Natural gas |
Yes |
No |
Base Case with HP | Natural gas |
No |
Yes |
Base Case with HP + CC | Natural gas |
Yes |
Yes |
Bio-CH4 | Biomethane + Natural gas |
No |
No |
Bio-CH4 + CC | Biomethane + Natural gas |
Yes |
No |
Bio-CH4 HP | Biomethane + Natural gas |
No |
Yes |
Bio-CH4 HP CC | Biomethane + Natural gas |
Yes |
Yes |
H2 | Hydrogen |
No |
No |
H2 HP | Hydrogen |
No |
Yes |
All Electric | Electricity |
No |
No |
All Electric + HP | Electricity |
No |
Yes |
The alternative configurations are evaluated under three scenarios: 2023, 2030, and 2050. The corresponding assumptions regarding commodity prices are listed in the Table below.
2023 |
2030 |
2050 |
|
|---|---|---|---|
CO₂ (€/t) | 70 |
100 |
150 |
Electricity (€/MWh) | 200 |
75 |
50 |
Hydrogen (€/MWh) | 200 |
75 |
50 |
Natural gas (€/MWh) | 37 |
37 |
37 |
How to interpret the graph
The following Pareto charts compare different decarbonization configurations for sugar production for the 2023, 2030, and 2050 scenarios. Each point represents a unique combination of boiler technology, CO₂ capture implementation, and heat pump integration, evaluated for cost, emissions, and energy consumption.
The leftmost boundary highlights the most cost-effective options for given emission reductions.