Economic Performance of Different Glass Production Routes
Scenario-specific analysis:
Scenario-specific analysis:
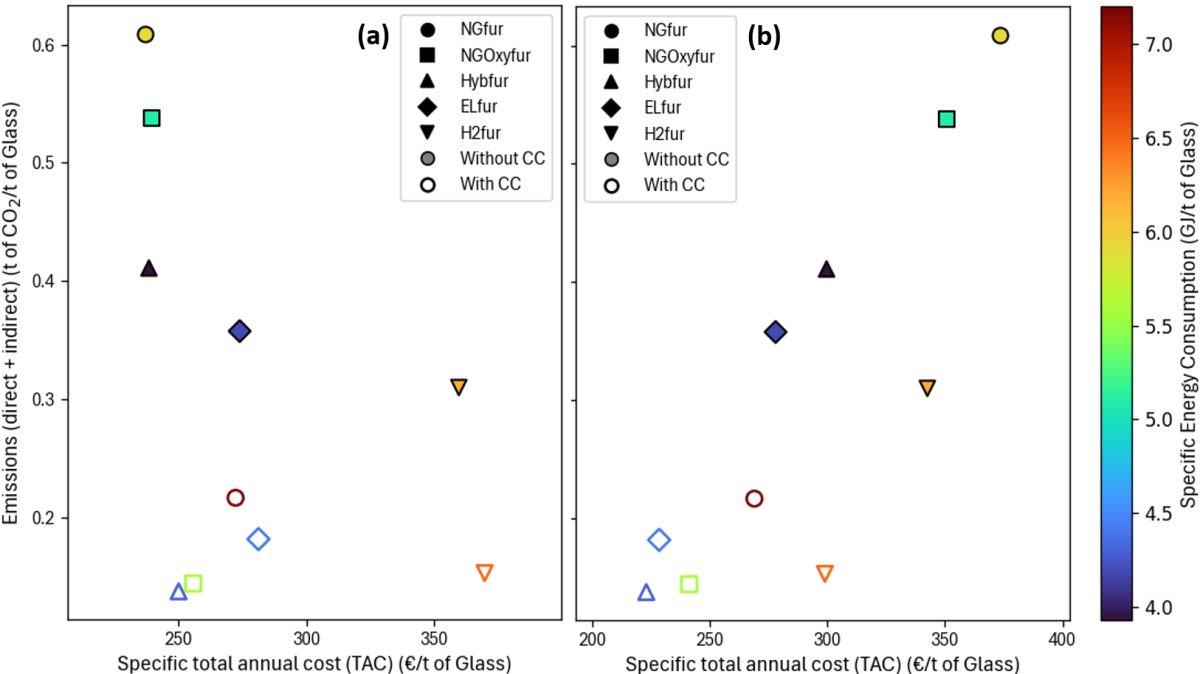
The graph below illustrates total CO₂ emissions (t CO₂/t glass) and specific total cost (€/t glass) across different decarbonization pathways for the glass sector. Click below to get details about the different decarbonization pathways.
The alternative configurations are evaluated under two scenarios: 2025 and 2050. The corresponding assumptions regarding emission factors and commodity prices are listed in the Table below.
|
|
Emission factors |
Commodities prices |
||
|---|---|---|---|---|
|
Scenarios |
2025 |
2050 |
2025 |
2050 |
|
Electricity |
145 gCO₂/kWh |
44 gCO₂/kWh |
78 €/MWh |
56 €/MWh |
|
Natural gas |
69 gCO₂/kWh |
69 gCO₂/kWh |
36 €/MWh |
35 €/MWh |
|
Hydrogen |
87 gCO₂/kWh |
44 gCO₂/kWh |
120 €/MWh |
78 €/MWh |
|
CO₂ (ETS) |
- |
- |
75 €/t |
250 €/t |
How to interpret the graph
The following Pareto chart compares different decarbonization configurations for flat glass production for the 2025 (left) and 2050 (right) scenarios. Each point represents a unique combination of furnace technology and CO₂ capture option, evaluated for cost, emissions, and energy consumption.
The leftmost boundary highlights the most cost-effective options for given emission reductions.
Technology mapping:
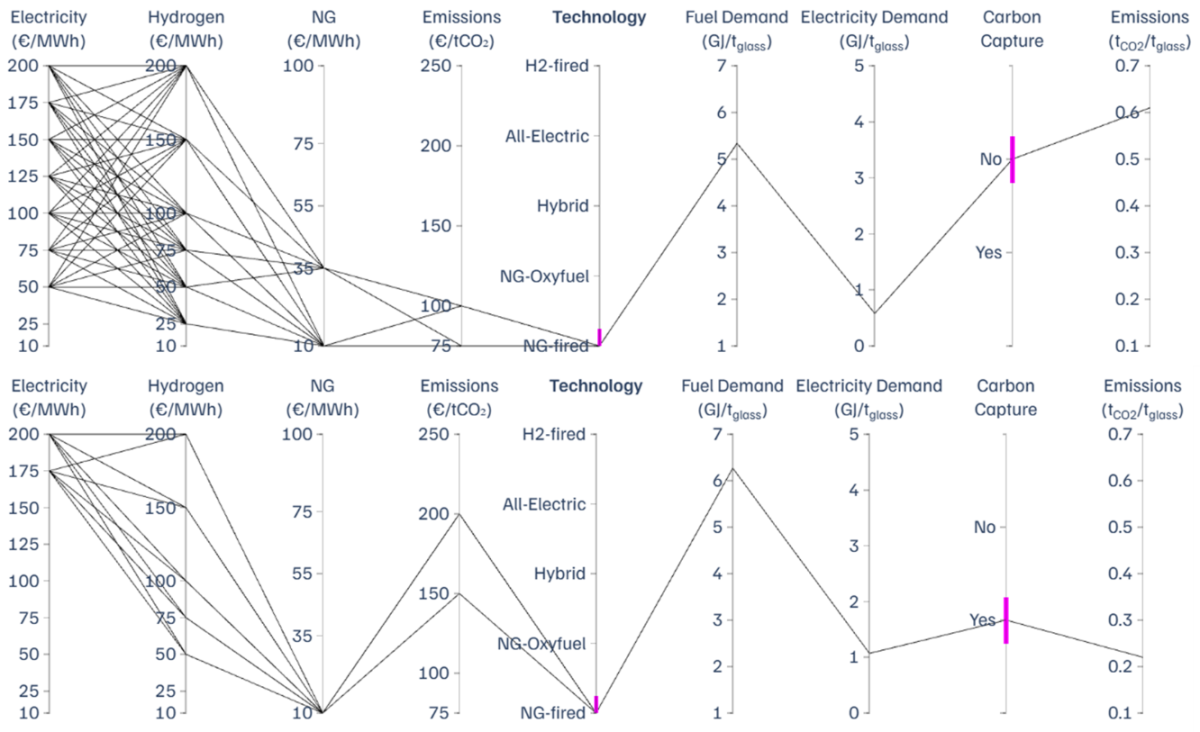
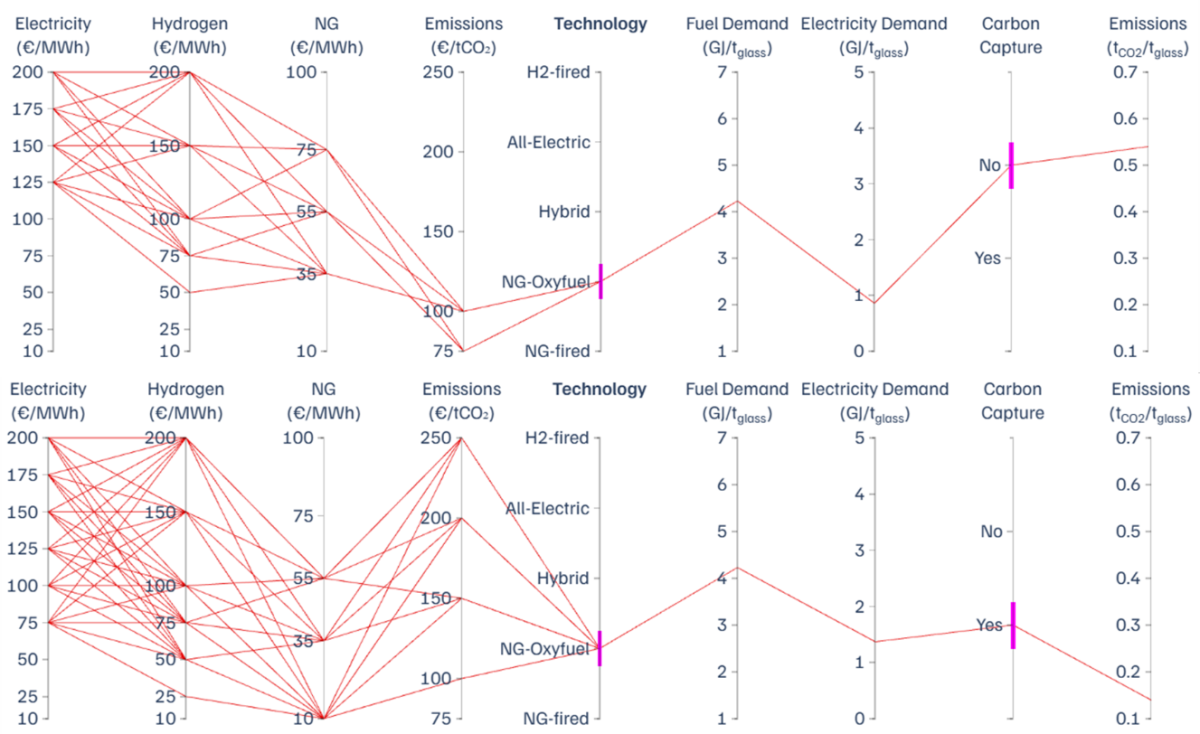
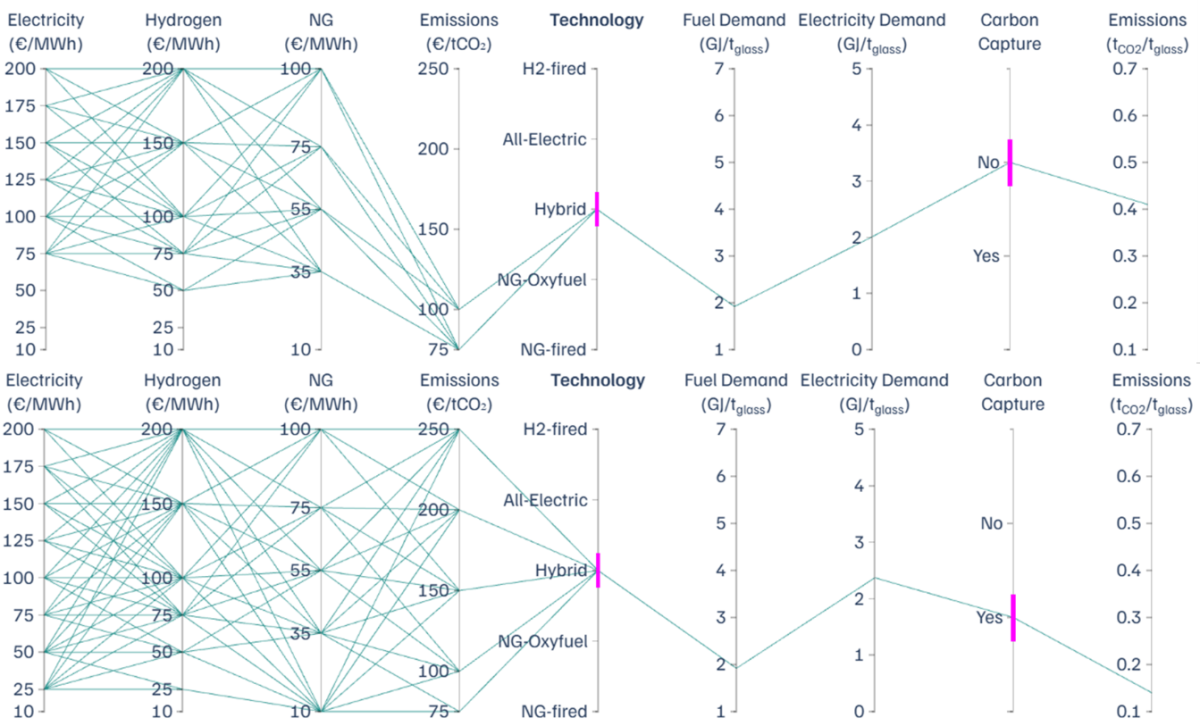
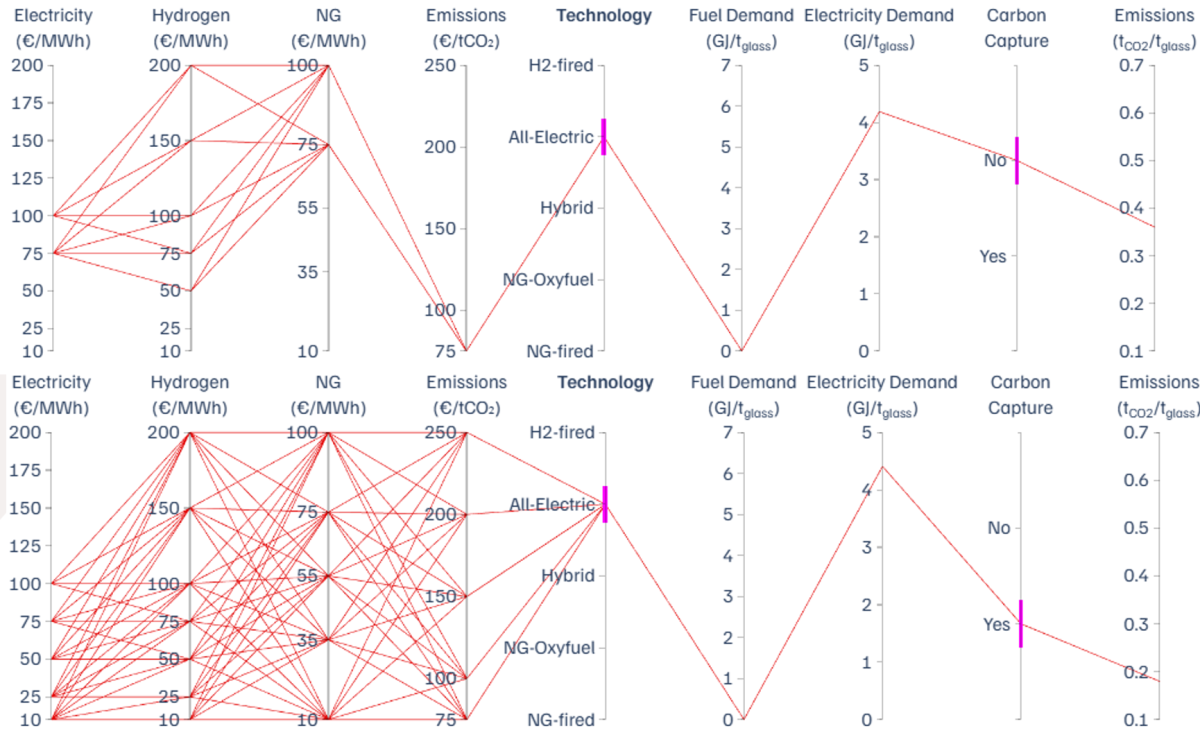
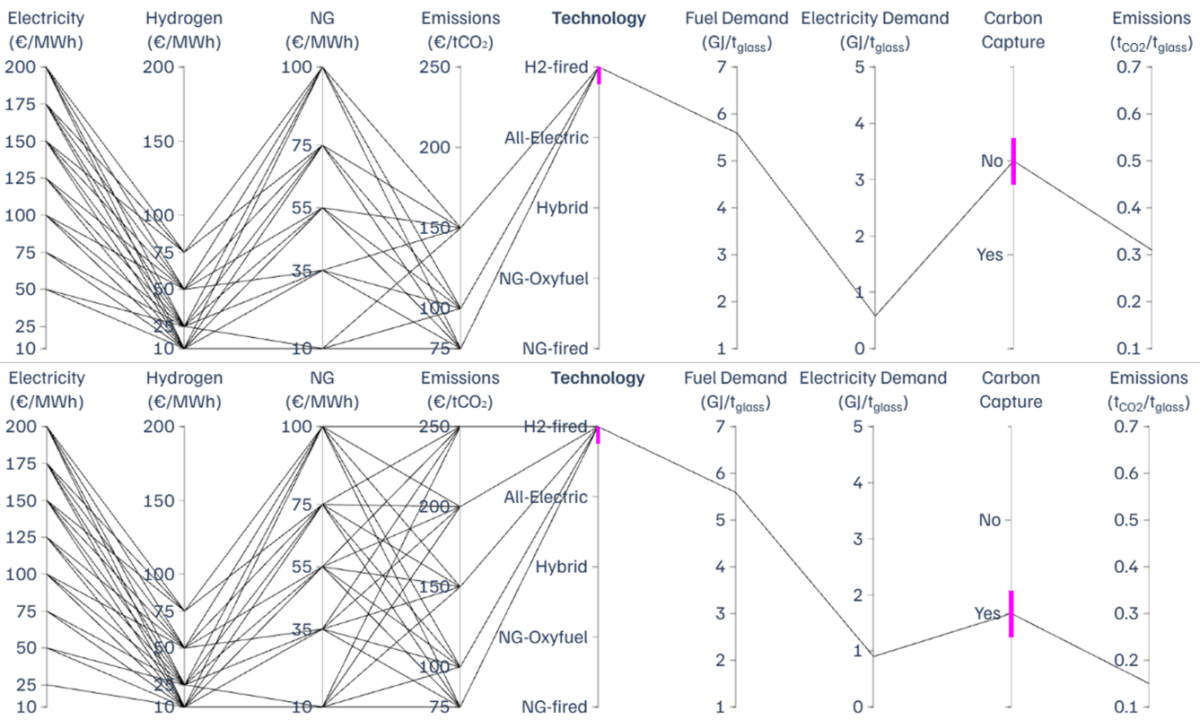
Optimal decarbonization pathways—those that achieve the lowest specific total cost—have been identified for the glass sector across a wide range of pricing scenarios, reflecting market volatility and uncertainty. The market conditions under which each decarbonization pathway is economically optimal are visualized in the parallel coordinates plots below.
Each line in a parallel coordinates plot represents an optimal solution for a specific combination of energy and emissions prices. The vertical axes show input parameters (electricity, hydrogen, natural gas, CO₂ prices), as well as the selected technology, fuel and electricity demand, carbon capture deployment and resulting emissions. By following a line from left to right, one can trace how a particular price scenario leads to a specific configuration and its associated performance metrics.
Natural gas air-fired furnaces:
Natural gas oxy-fired furnaces:
Hybrid furnaces:
Electric furnaces:
Hydrogen-fired furnaces: